

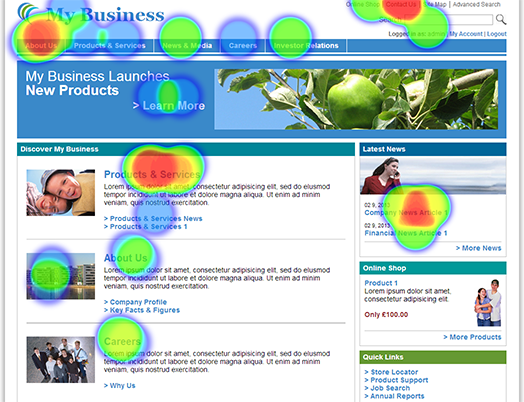
Heat Map
Visualize user behaviors by heat map
While using heat map provided by HeartCore, action from website visitors can be visible. The user’s mouse click and trajectory will be used to identify user’s interest. Since HeartCore’s heat map is able to display every user segment, action pattern properties on all pages can be visible. Page transition is linked with Google Analytics, every user segment is visible.
Although there are many HeartCore map tools, only all-user patterns can be identified, in other words, meaning it is the only element that is understood and this is not useful at all. In HeartCore, every specific user property can be visible. For example, the action pattern on the pages visited by a female in her 20s, the action pattern of a male in his 30s, every area, action pattern in Kyushu area, and action pattern in Hokkaido area. In this way, the behavior pattern of each visitor, such as which generation, which area and which company, can be analyzed.
To confirm whether the interest of the user who used the site in the intention from the website administration is drawn and discovered when the point that was assumed if an attention degree is low, and gathers interest unexpectedly. This can make use of the review of a page layout and site constitution by visualizing the strength and weakness of a site. With this function, including the linked Google Analytics and Facebook Insights function, movement inside pages, transitions and social movements can all be identified.
These special features are exclusive to HeartCore.